This program is for basic serial communication. It supports input and output.
Supported OS WIN, LINUX, MAC (coming soon…)
Preperlation
> pip3 install -r requirements.txt

- If it does not work, enter the following command and install it again.

> pip3 uninstall -r requirements.txt
Run UART
usage: UART.py [-h] -p /dev/ttyUSB1 [-buad 9600] [-bsize 8] [-prty N] [-sbits 1] [-tout 1] [-xonxoff] [-rtscts] [-wtout 1] [-dsrdtr] [-ibtout None] [-exclusive True]
               [-w WATCH_PATTERN [WATCH_PATTERN ...]] [-e]

optional arguments:
  -h, --help
          show this help message and exit
  -p /dev/ttyUSB1, --port /dev/ttyUSB1
          Enter device path for uart connection. i.e (/dev/ttyUSB1, COM30, etc...)
  -buad 9600, --baudrate 9600
          Baud rate such as 9600 or 115200 etc. (Default : 115200)
  -bsize 8, --bytesize 8
          Number of data bits. (Default : 8)
          choices [5, 6, 7, 8]
  -prty N, --parity N
          Enable parity checking. (Default : N)
          choices=[N, E, O, M, S]
  -sbits 1, --stopbits 1
          Number of stop bits. (Default : 1)
          choices=[1, 1.5, 2]
  -tout 1, --timeout 1
          Set a read timeout value in seconds. (Default : None)
  -xonxoff, --xonxoff
          Enable software flow control. (Default : False)
          if this feature activated xonxoff is True state.
  -rtscts, --rtscts
          Enable hardware (RTS/CTS) flow control. (Default : False)
          if this feature activated rtscts is True state.
  -wtout 1, --write_timeout 1
          Set a write timeout value in seconds. (Default : None)
  -dsrdtr, --dsrdtr
          Enable hardware (DSR/DTR) flow control. (Default : False)
          if this feature activated dsrdtr is True state.
  -ibtout None, --inter_byte_timeout None
           Inter-character timeout. (Default : None)
  -exclusive True, --exclusive True
          Set exclusive access mode (POSIX only).
          A port cannot be opened in exclusive access mode
          if it is already open in exclusive access mode.(Default : None)
  -w WATCH_PATTERN [WATCH_PATTERN ...], --watch WATCH_PATTERN [WATCH_PATTERN ...]
          Enter the Watch pattern what you want. entered pattern ignores case.
          Patterns are separated by spaces.
          e.g. -w ASSERT WARNING ERROR etc...
  -e, --watch_end
          When this feature is activated, it is automatically terminated when the pattern is matched.

i.e) > LINUX : 'sudo python3 UART.py -p /dev/ttyUSB1'
     > WIN   : 'python3 UART.py -p COM27'

See help for more information.
Log Directory
Windows
'C:\Users\[USERNAME]\log'
Ubuntu
'~/log'
Warning : If you want to view the log, run it as administrator privileges.
You give it raw scans, and you get pages ready to be printed or assembled into a PDF
or DJVU file. Scanning, optical character recognition,
and assembling multi-page documents are out of scope of this project.
Scan Tailor is Free Software (which is more than just freeware).
It’s written in C++ with Qt and released under the General Public License version 3.
We develop both Windows and GNU/Linux versions.
History and Future
This project started in late 2007 and by mid 2010 it reached production quality.
For information on contributing and the longstanding plan for the project, please see the Roadmap wiki entry.
For any suggested changes or bugs, please consult the Issues tab.
Usage
Scan Tailor is being used not just by enthusiasts, but also by libraries and other institutions.
Scan Tailor processed books can be found on Google Books and the Internet Archive.
Prolog for Programmers. The 47.3MB pdf is the original,
and the 3.1MB pdf is after using Scan Tailor. The OCR, Chapter Indexing, JBIG2 compression, and PDF Binding were not
done with Scan Tailor, but all of the scanned image cleanup was. [1]
Herons and Cobblestones: A History of Bethel and the Five Oaks Area of Brantford Township,
County of Brant by the Grand River Heritage Mines Society [2]
Include '/opt/bitnami/projects/iplan/conf/httpd-app.conf'
Edit /opt/bitnami/apache2/conf/bitnami/bitnami.conf as sudo.
<VirtualHost _default_:80>
    WSGIScriptAlias /iplan /opt/bitnami/projects/iplan/iplan/wsgi.py
    Alias /static /opt/bitnami/projects/iplan/static

    <Directory /opt/bitnami/projects/iplan/static>ration not p
        Require all granted
    </Directory>

    <Directory /opt/bitnami/projects/iplan>
        AllowOverride all
        Require all granted
        Options FollowSymlinks
    </Directory>

    DocumentRoot /opt/bitnami/projects/iplan
</VirtualHost>

Include "/opt/bitnami/apache/conf/bitnami/bitnami-ssl.conf"
Edit the iplan/prod_settings.py file for production.
# Static File settings
STATIC_URL = '/static/'
STATIC_ROOT = '/opt/bitnami/projects/iplan/static'

# Redirect to URL after login (defaults to /accounts/profile)
LOGIN_REDIRECT_URL = '/iplan/planner/'

# Redirect to URL for login (defaults to /accounts/login)
LOGIN_URL = '/planner/login'

# WSGI settings
ALLOWED_HOSTS = ['yourdjangosite.com']

# Settings for Django send_mail()
SITE_URL = 'yourdjangosite.com'
ENV_FILE=str(Path(BASE_DIR)) + 'your_environment_file_name'
from dotenv import dotenv_values
myvars = dotenv_values(ENV_FILE)
EMAIL_HOST = myvars['EMAIL_HOST']
EMAIL_PORT = 587
EMAIL_HOST_USER = myvars['EMAIL_HOST_USER']
EMAIL_USE_SSL = False
EMAIL_USE_TSL = True
EMAIL_HOST_PASSWORD = myvars['EMAIL_HOST_PASSWORD']
EMAIL_BACKEND = 'django.core.mail.backends.smtp.EmailBackend'
Add the sensitive variables in the file defined in the variable ENV_FILE in settings.py and prod_settings.py.
Feature:
As a newbie in API-Platform, I want to document myself in many features
Scenario: I should be able to see the main documentation Given I am on "https://github.com/"And I should see "REST and GraphQL framework to build modern API-driven projects"Scenario: I should be able to see the main documentation Given I am on "https://github.com/"And I go to "/docs/distribution/"Then I should see "API Platform is the most advanced API platform, in any framework or language."Scenario: I should be able to document myself about GraphQL supportGiven I am on "https://github.com/"And I follow "Get started"When I follow "Adding GraphQL Support"Then I should be on "/docs/distribution/#adding-graphql-support"Then I should see "You now have a GraphQL API!"Scenario: I should be able to document myself about GraphQL support thanks to the search fieldGiven I am on "https://github.com/"When I fill in "SEARCH..." with "GraphQL"And I wait for "#algolia-autocomplete-listbox-0"Then I should see "Documentation"And I should see "Search by"And I should see "Enabling GraphQL"Scenario: I should be able to test the demo Given I am on "https://github.com/"And I follow "Demo"Then I should be on "https://demo-client.api-platform.com/"When I follow "API"Then I should be on "https://demo.api-platform.com/"Scenario: I should be able to test the demo Given I am on "https://github.com/"And I follow "Community"And I create a new client "test" using the "chrome" driver
Then I switch to client "test"And I go to "https://github.com/"Then I should see "REST and GraphQL framework to build modern API-driven projects"Then I remove the client "test"Then I should see "API Platform's community"
6 scenarios (6 passed)
29 steps (29 passed)
0m28.61s (20.63Mb)
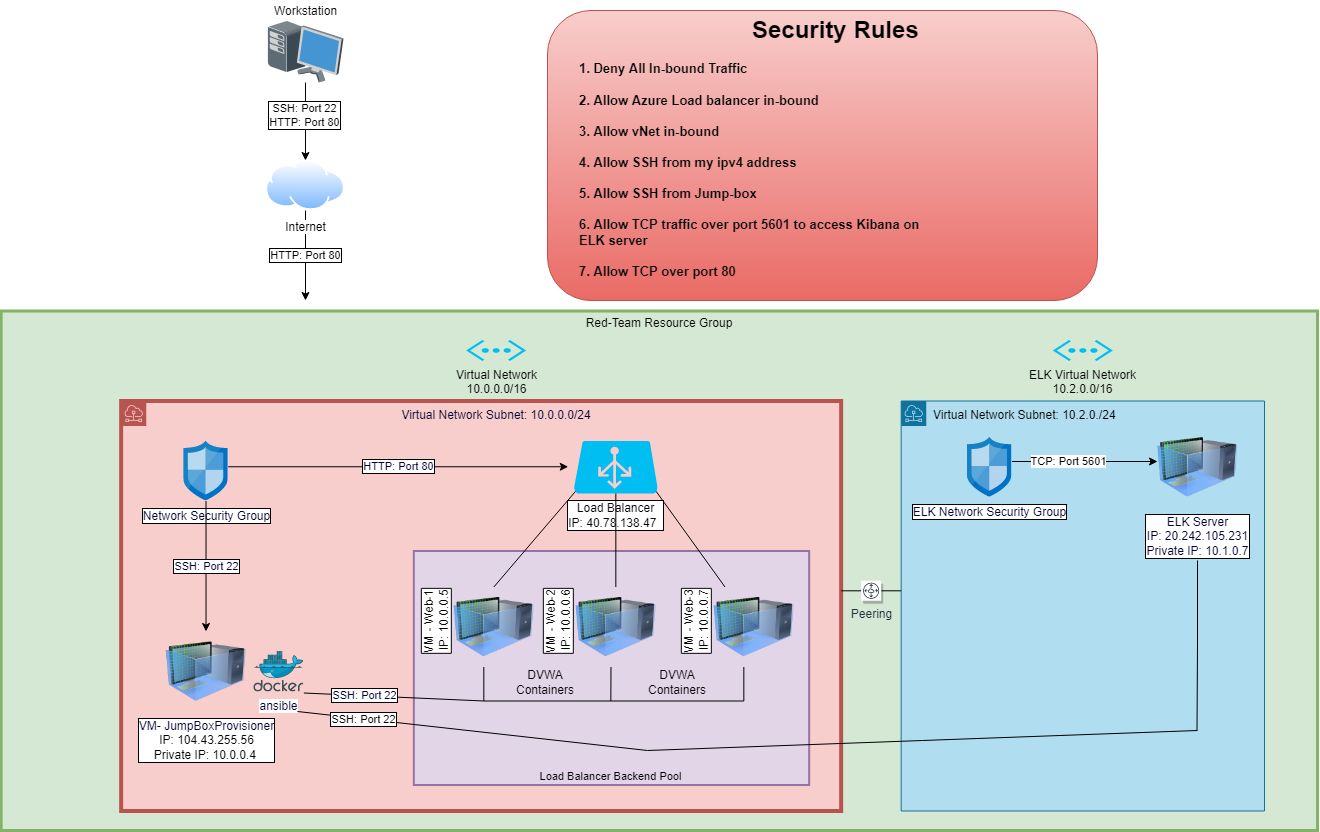
The files in this repository were used to configure the network depicted below.
These files have been tested and used to generate a live ELK deployment on Azure. They can be used to either recreate the entire deployment pictured above. Alternatively, select portions of the Configuration and YAML files may be used to install only certain pieces of it, such as Filebeat.
The main purpose of this network is to expose a load-balanced and monitored instance of DVWA, the D*mn Vulnerable Web Application.
Load balancing ensures that the application will be highly available, in addition to restricting inbound access to the network.
What aspect of security do load balancers protect?
Load balancers are designed to take a load of traffic and distribute it across multiple resources preventing servers to overload.
Load balancers play an important role in security by defending against distributed denial-of-service (DDoS) attacks.
What is the advantage of a jump box?
Jump box virtual machine is exposed on the public network to withstand malicious threats and attacks. It is also used to manage other systems and hardens security, it is treated as a single entryway to a server group from within your security zone.
The advantage of having a jump box is that it limits access to servers that are inaccessible over the network.
Integrating an ELK server allows users to easily monitor the vulnerable VMs for changes to
What does Filebeat watch for?
Filebeat: collects data and logs about the file system.
What does Metricbeat record?
Metricbeat: collects machine metrics and statisics, such as uptime.
The configuration details of each machine may be found below.
Name
Function
IP Address
Operating System
Server
Jump Box
Gateway
104.43.255.56; 10.0.0.1
Linux
Ubuntu Server 18.04 LTS
Web-1 VM
DVWA Server
10.0.0.5
Linux
Ubuntu Server 18.04 LTS
Web-2 VM
DVWA Server
10.0.0.6
Linux
Ubuntu Server 18.04 LTS
Web-3 VM
DVWA Server
10.0.0.7
Linux
Ubuntu Server 18.04 LTS
ELK Server
Monitoring
20.242.105.231; 10.1.0.7
Linux
Ubuntu Server 18.04 LTS
Note: In addition to above, Azure has provisioned a load balancer in front of all the machines except for Jump-Box. The load balancer’s target are organized into the following availability zones: Web-1, Web-2, Web-3
Access Policies
The machines on the internal network are not exposed to the public Internet.
Only the Jump Box Provisioner machine can accept connections from the Internet. Access to this machine is only allowed from the following IP addresses:
Add whitelisted IP addresses: Local Admin IP, Workstation (My Personal IP)
Machines within the network can only be accessed by Workstation (My IP) and Jump Box Provisioner.
Which machine did you allow to access your ELK VM?
Jump Box Provisioner IP: 10.0.0.4 via SSH Port 22
What was its IP address?
Local Admin IP, Workstation (My Personal IP) via port TCP 5601
A summary of the access policies in place can be found in the table below.
Name
Publicly Accessible
Allowed IP Addresses
Port
Server
Jump Box
Yes
Local Admin IP
SSH 22
Ubuntu Server 18.04 LTS
Web-1 VM
No
10.0.0.5
SSH 22
Ubuntu Server 18.04 LTS
Web-2 VM
No
10.0.0.6
SSH 22
Ubuntu Server 18.04 LTS
Web-3 VM
No
10.0.0.7
SSH 22
Ubuntu Server 18.04 LTS
Elk Server
No
Local Admin IP
TCP 5601
Ubuntu Server 18.04 LTS
Elk Configuration
Ansible was used to automate configuration of the ELK machine. No configuration was performed manually, which is advantageous because…
What is the main advantage of automating configuration with Ansible?
Ansible is an open source tool with simple configuration management, cloud provisioning and application development.
Allows you to deploy YAML playbooks.
Click here to view Steps on Creating an ELK Server.
We will create an ELK server within a virtual network. Specifically we will:
Create a new vNet
Create a Peer Network Connection
Create a new VM
Create an Ansible Playbook
Downloading and Configuring the Container
Launch and Expose the Container
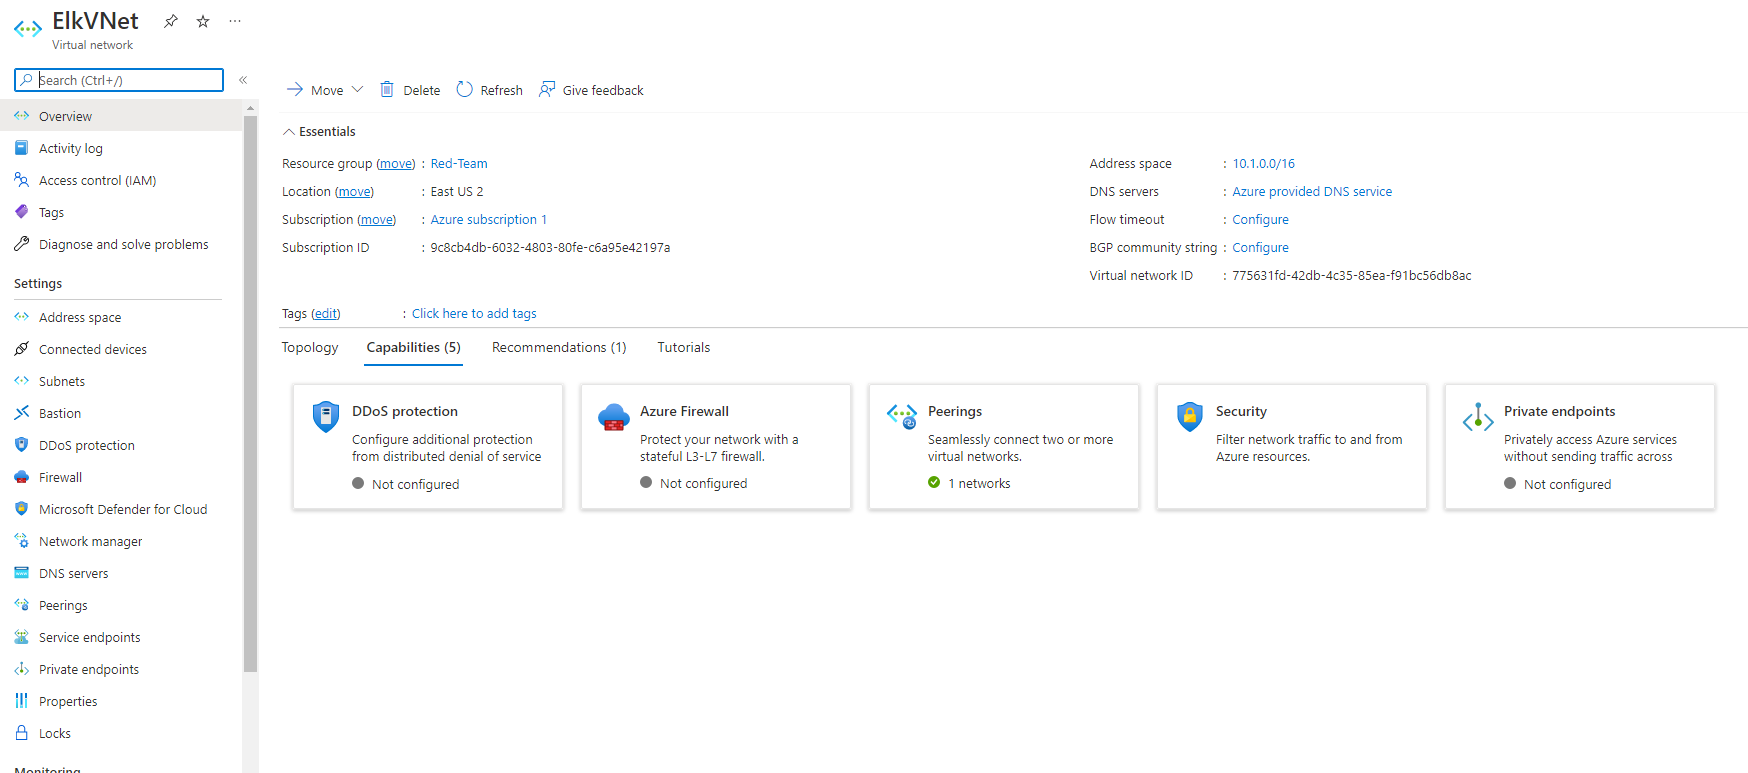
Creating a New vNet
Create a new vNet located in the same resouce group you have been using.
Make sure this vNet is located in a new region and not the same region as your other VM’s.
Leave the rest of the settings at default.
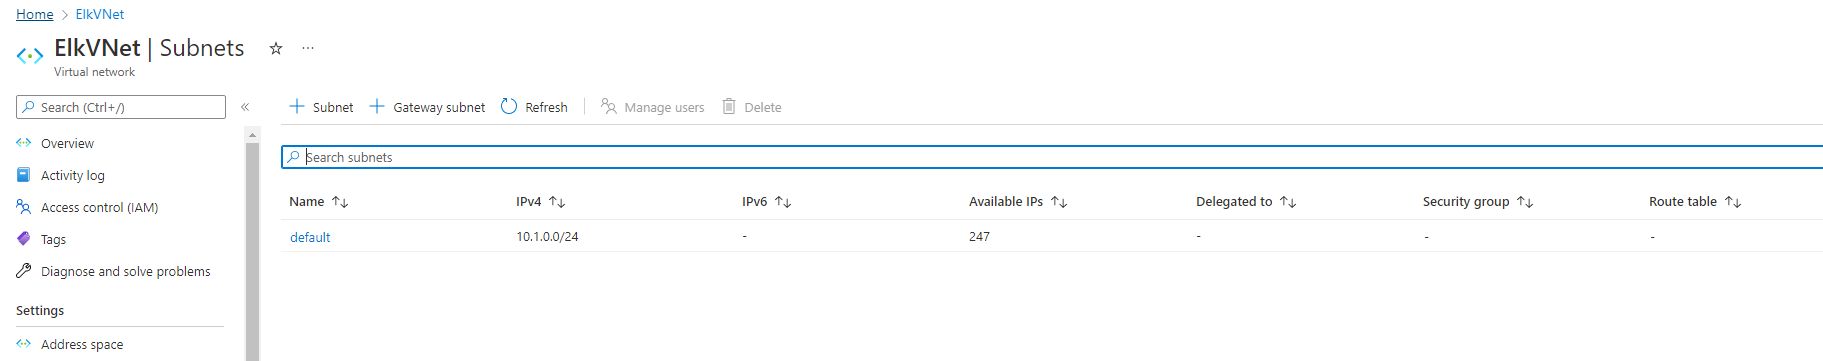
Notice, in this example that the IP addressing is automatically created a new network space of 10.1.0.0/16. If your network is different (10.1.0.0 or 10.3.0.0) it is ok as long as you accept the default settings. Azure automatically creates a network that will work.
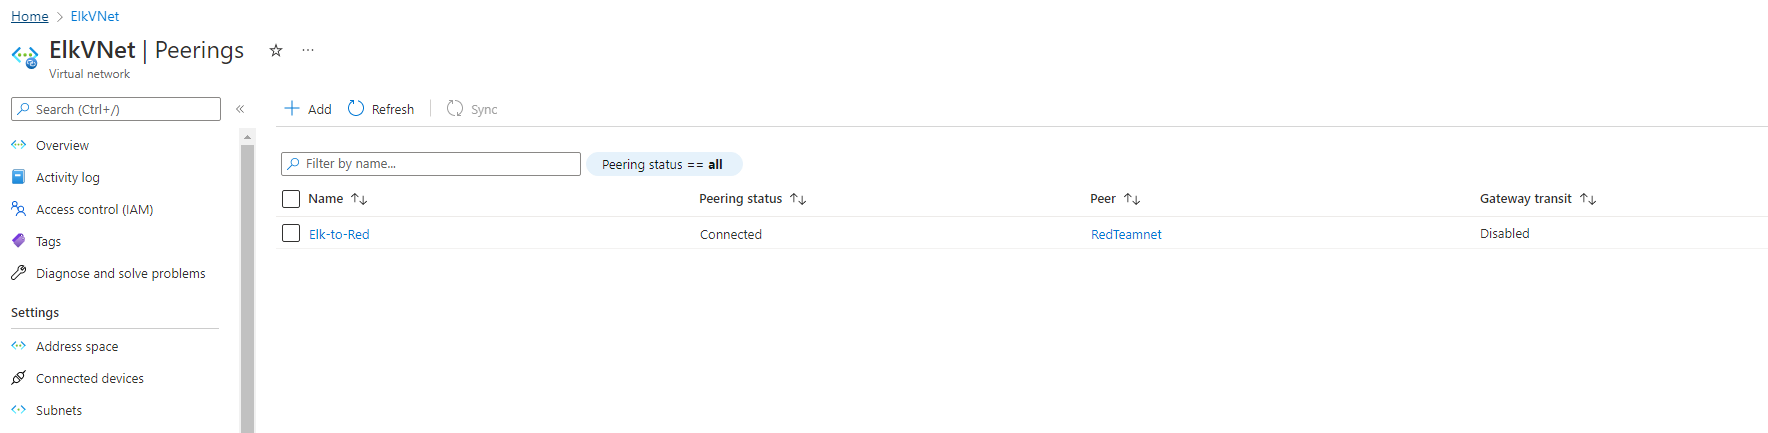
Create a Peer Network Connection
Create a Peer network connection between your vNets. This will allow traffic to pass between you vNets and regions. This peer connection will make both a connection from your first vNet to your second vNet and a reverse connection from your second vNet back to your first vNet. This will allow traffic to pass in both directions.
Navigate to ‘Virtual Network’ in the Azure Portal.
Select your new vNet to view it’s details.
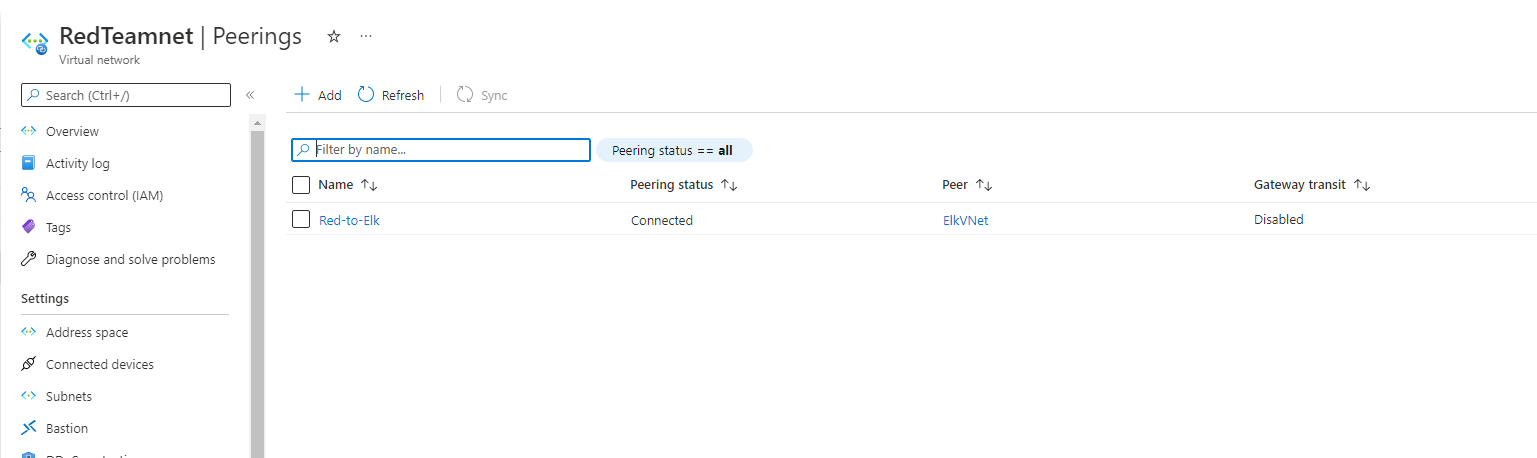
Under ‘Settings’ on the left side, select ‘Peerings’.
Click the + Add button to create a new Peering.
Make sure your new Peering has the following settings:
A unique name of the connection from your new vNet to your old vNet.
Elk-to-Red would make sense
Choose your original RedTeam vNet in the dropdown labeled ‘Virtual Network’. This is the network you are connecting to your new vNet and you should only have one option.
Name the resulting connection from your RedTeam Vnet to your Elk vNet.
Red-to-Elk would make sense
Leave all other settings at their defaults.
The following screenshots displays the results of the new Peering connections with your ELK vNet to your old vNet
Create a new VM
Creating a new VM
Creating a new Ubuntu VM in your virtual network with the following configures:
VM must have at least 4GB of RAM.
IP address must be same as public IP address.
The VM must be added to the new region in which you created your new vNet and create a new basic network security group for it.
After creating the VM make sure that it works by connecting to it from your Jump-box using ssh username@jump.box.ip
ssh RedAdmin@104.43.255.56
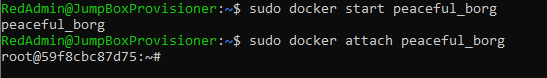
Check your Ansible container: sudo docker ps
Locate the container name: sudo docker container list -a
Start the container: sudo docker container start peaceful_borg
Attach the container: sudo docker attach peaceful_borg
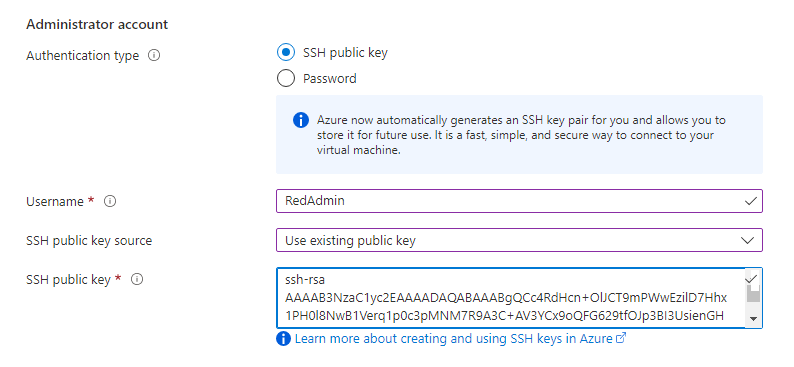
Copy the SSH key from the Ansible container on your jump box: cat ~/.ssh/id_rsa.pub
Configure a new VM using that SSH key.
Configuring Container
Downloading and Configuring Container
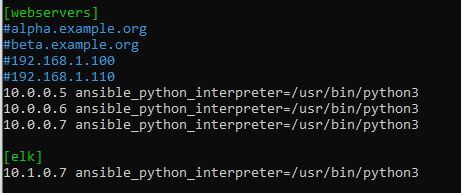
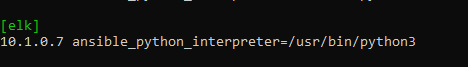
Configure your hosts file inside ansible: cd /etc/ansible/ configure nano /etc/ansible/hosts and input the IP addresses of your VM with ansible_python_intrepreter=/usr/bin/python3
Create a Playbook that installs Docker and configures the container
- name: Use more memorysysctl:
name: vm.max_map_countvalue: 262144state: presentreload: yes
Download and Launch a Docker ELK Container with ports 5601, 9200, 5044.
- name: Download and launch a docker elk containerdocker_container:
name: elkimage: sebp/elk:761state: startedrestart_policy: alwaysports:
- 5601:5601
- 9200:9200
- 5044:5044
Enable Service Docker on Boot
- name: Enable service docker on bootsysmd:
name: dockerenabled: yes
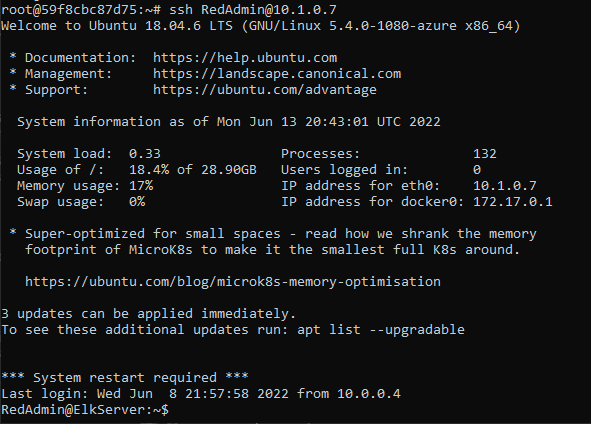
After the ELK container is installed, SSH into your container ssh username@your.ELK-VM.External.IP and double check that elk-docker container is running.
ssh RedAdmin@10.1.0.7
The screenshot displays the results when successfully connected to ELK via SSH
The following screenshot displays the result of running docker ps after successfully configuring the ELK instance.
Restrict access to the ELK VM using Azure network security groups.
You will need to add your public IP address to a whitelist. Opening virtual network existing NSG and create an incoming rule for your security group that allows TCP traffic port 5601 from your public IP address.
Verify that you can access your server by navigating to http://[your.ELK-VM.External.IP]:5601/app/kibana. Use the public IP address of your new VM.
http://20.242.105.231:5601/app/kibana
You should see this page:
If you can get on this page, congratulations! You have successfully created an ELK Server!
Target Machines & Beats
This ELK server is configured to monitor the following machines:
Web-1 VM: 10.0.0.5
Web-2 VM: 10.0.0.6
Web-3 VM: 10.0.0.7
We have installed the following Beats on these machines:
Filebeat
Metricbeat
These Beats allow us to collect the following information from each machine:
Filebeat:
Filebeat monitors the specified log file or location, collects log events, and forwards them to Elasticsearch or Logstash for indexing.
Filebeat is used to collect and send log files.
Filebeat can be installed on almost any operating system, including Docker containers. It also contains internal modules for specific platforms such as Apache, MySQL, and Docker, including default configurations and Kibana objects for these platforms.
Metricbeat:
Metricbeat helps monitor your server by collecting metrics and statistics that are collected and sent to the specific from the systems and services running on your server.
Like Filebeat, Metricbeat supports an internal module for collecting statistics from a particular platform.
You can use these modules and a subset called metric sets to configure how often Metricbeat collects metrics and the specific metrics it collects.
We use it for failed SSH login attempts, sudo escalations, and CPU/RAM statistics.
Click here to view Steps on Creating Filebeat and Metricbeat.
We will create two tools that will help our ELK monitoring server which are Filebeat and Metricbeat. Specifically we will:
Install Filebeat and Metricbeat on the Web VM’s
Create the Filebeat and Metricbeat Configuration File
Create a Filebeat and Metricbeat Installation Playbook
Verify Filebeat and Metricbeat is Installed
Installing Filebeat and Metricbeat on DVWA Container
Make sure that ELK container is running:
Navigate to Kibana: http://[your.ELK-VM.External.IP]:5601/app/kibana. Use public IP address of the ELK server that you created.
If Kibana is not up and running, open a terminal on your PC and SSH into ELK Server and start your ELK-docker.
Run docker container list -a
sudo docker start elk
Use ELK’s server GUI to navigate and install Filebeat instructions for Linux.
Navigate to your ELK server’s IP:
Click on Add log data
Select System Logs
Click on DEB tab under Getting Started
Using ELK’s server GUI to navigate and install Metricbeat instructions for Linux.
Naviate to your ELK’s server’s IP:
Click on ‘Add metric data`
Select Docker metrics
Click on DEB tab under Getting Started
Create Filebeat and Metricbeat Configuration File
We will create and edit the Filebeat and Metricbeat configuration file.
Start by opening a terminal and SSH into your Jump-box and start up the Ansible container.
Scroll down to line #1806 and replace the IP address with the IP address of your ELK VM.
  	setup.kibana:
   	host: "10.1.0.7:5601"
When finished save both files in /etc/ansible/files
Creating Filebeat and Metricbeat Installation Playbook
Create Filebeat and Metricbeat Playbooks and save it in /etc/ansible/roles directory.
First, nano filebeat-playbook.yml with Filebeat template below:
- name: installing and launching filebeathosts: webserversbecome: yestasks:
- name: download filebeat debcommand: curl -L -O curl -L -O https://artifacts.elastic.co/downloads/beats/filebeat/filebeat-7.6.1-amd64.deb
- name: install filebeat debcommand: dpkg -i filebeat-7.6.1-amd64.deb
- name: drop in filebeat.ymlcopy:
src: /etc/ansible/files/filebeat-config.ymldest: /etc/filebeat/filebeat.yml
- name: enable and configure system modulecommand: filebeat modules enable system
- name: setup filebeatcommand: filebeat setup
- name: start filebeat servicecommand: service filebeat start
- name: enable service filebeat on bootsystemd:
name: filebeatenabled: yes
Next, nano metricbeat-playbook.yml with Metricbeat template below:
- name: Install metric beathosts: webserversbecome: truetasks:
# Use command module
- name: Download metricbeatcommand: curl -L -O https://artifacts.elastic.co/downloads/beats/metricbeat/metricbeat-7.6.1-amd64.deb# Use command module
- name: install metricbeatcommand: dpkg -i metricbeat-7.6.1-amd64.deb# Use copy module
- name: drop in metricbeat configcopy:
src: /etc/ansible/files/metricbeat-config.ymldest: /etc/metricbeat/metricbeat.yml# Use command module
- name: enable and configure docker module for metric beatcommand: metricbeat modules enable docker# Use command module
- name: setup metric beatcommand: metricbeat setup# Use command module
- name: start metric beatcommand: service metricbeat start# Use systemd module
- name: enable service metricbeat on bootsystemd:
name: metricbeatenabled: yes
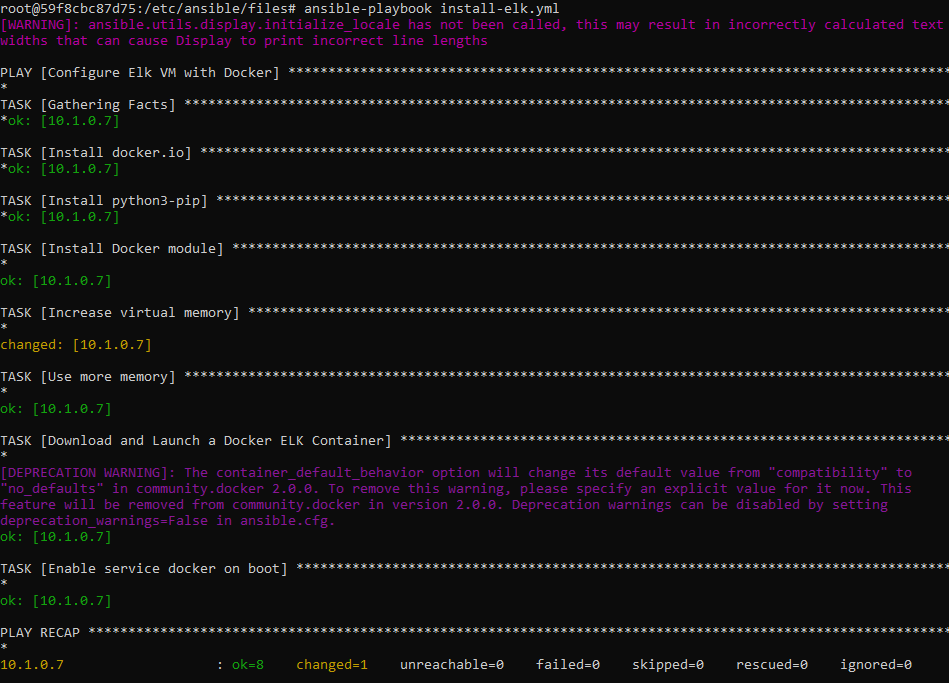
Run both playbooks to confirm that it works. ansible-playbook filebeat-playbook.yml and ansible-playbook metricbeat-playbook.yml
This screenshot displays the results for filebeat-playbook:
This screenshot displays the results for metricbeat-playbook:
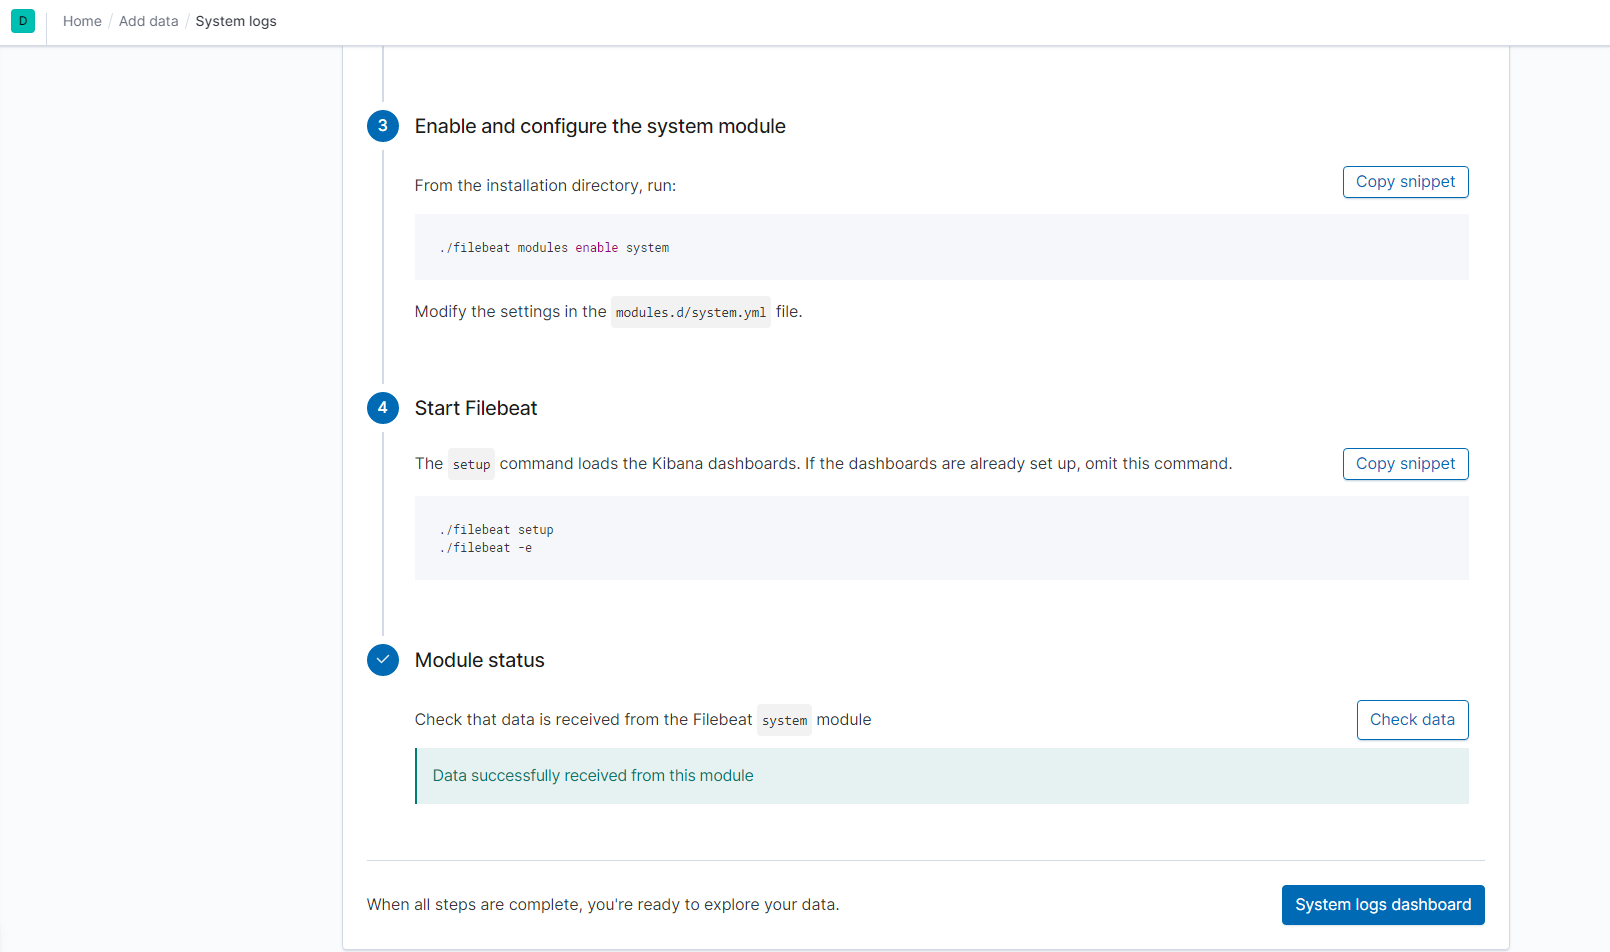
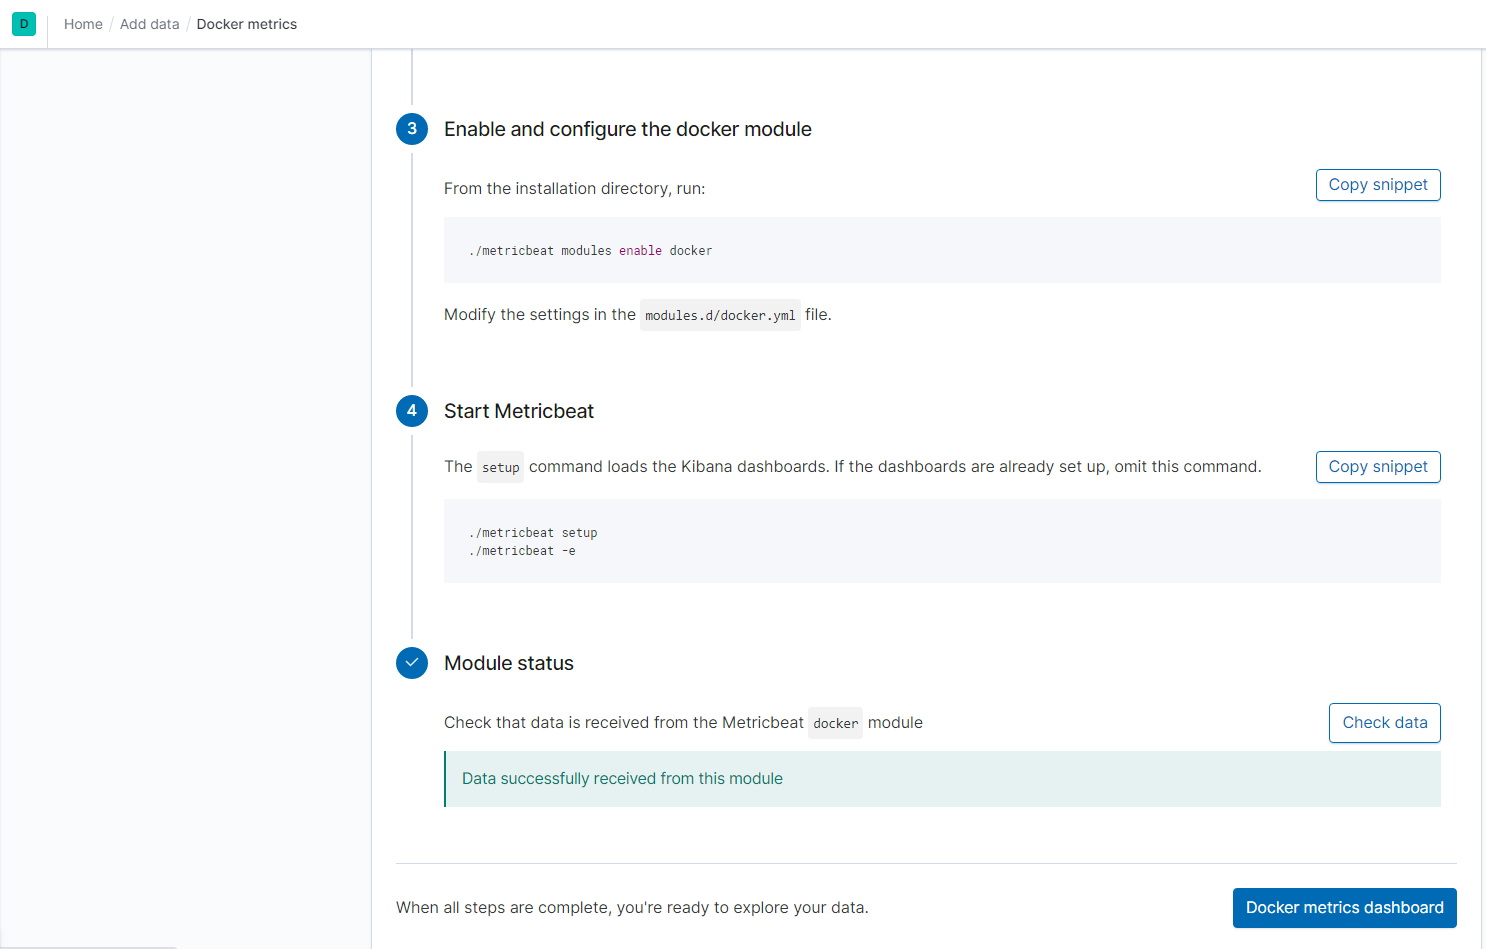
Verify that the playbook works by navigating to the Filebeat and Metricbeat installation page on the ELK Server GUI and under Step 5: Module Status and click on Check Data.
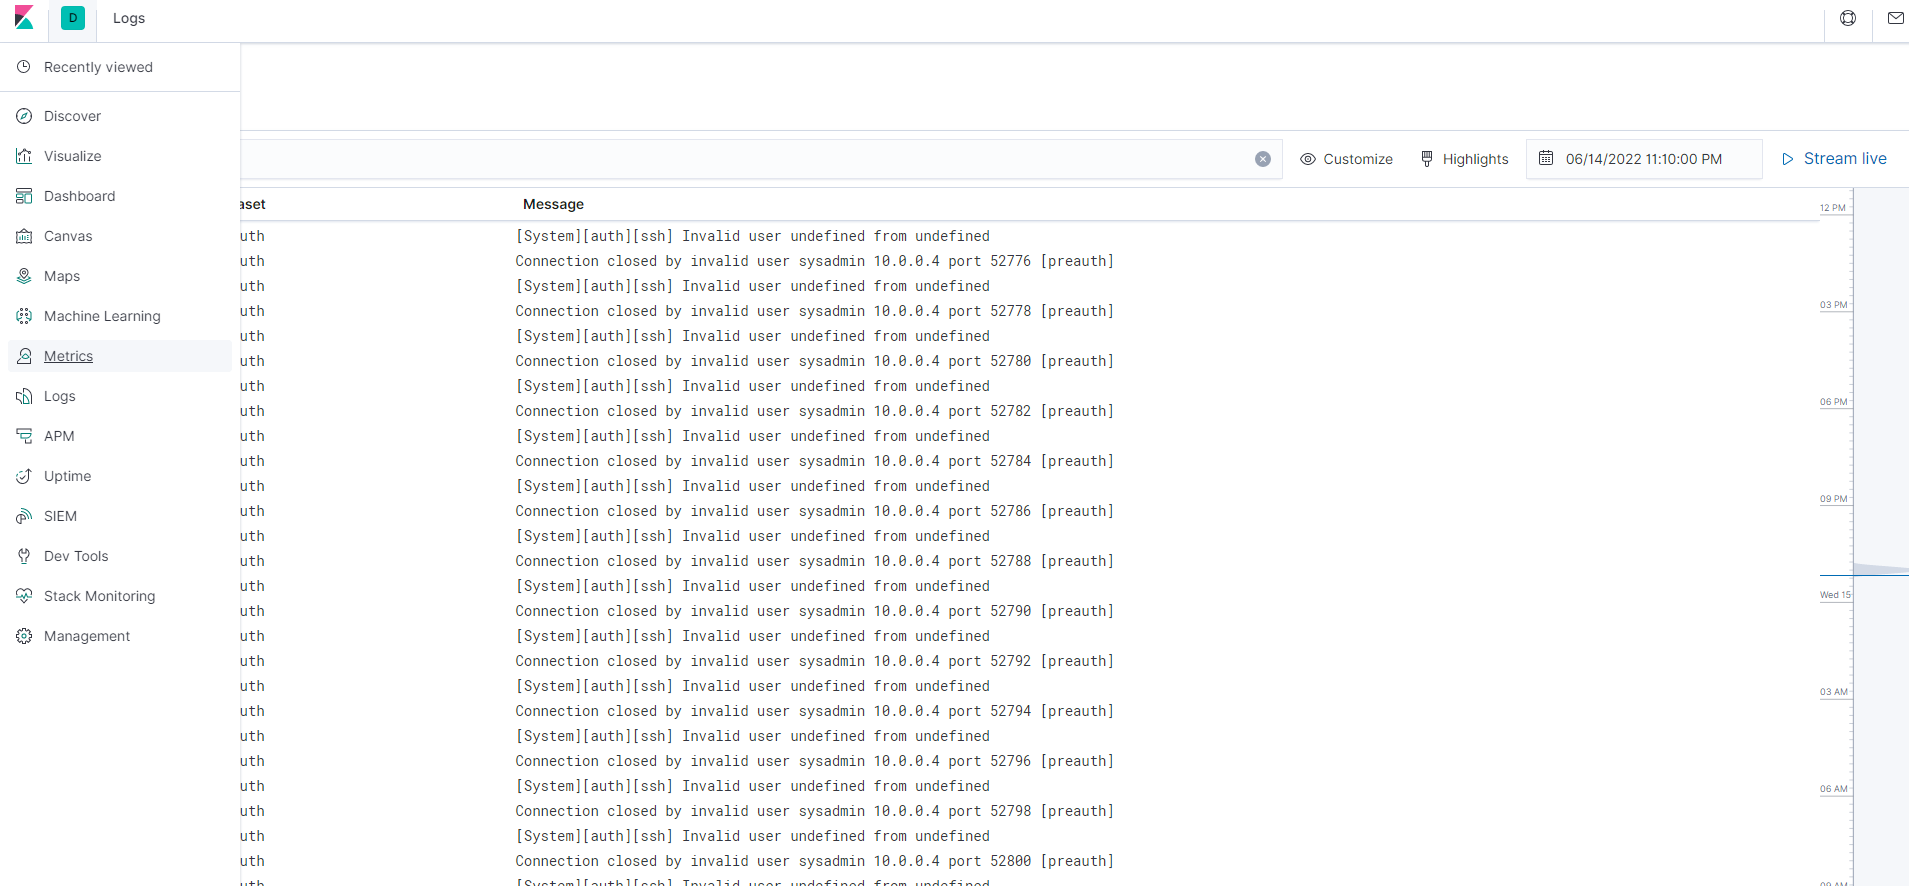
The screenshot display the results of ELK stack successfully receiving logs.
The screenshot display the results of ELK stack successfully receiving metrics.
Using the Playbook
In order to use the playbook, you will need to have an Ansible control node already configured. Assuming you have such a control node provisioned:
SSH into the control node and follow the steps below:
FalsoJNI (falso as in fake from Italian) is a simple, zero-dependency fake
JVM/JNI interface written in C.
It is created mainly to make JNI-heavy Android→PSVita ports easier, but probably
could be used for other purposes as well.
Setup
Since there are no dependencies, FalsoJNI is not supplied with a Makefile of its
own, so to get started just include in your own Makefile/CMakeLists.txt
all the source files:
Second thing you need to do, is to create your own FalsoJNI_Impl file. You
will use it later to provide implementations for custom JNI Methods (the
ones called with jni->CallVoidMethodV and similars) and Fields.
To do this, from FalsoJNI_ImplSample.h copy the definitions between COPY STARTING FROM HERE! and COPY UP TO HERE! to your project in any .c
file (you could also split it up into several files if you need to).
After that, you already init FalsoJNI and supply JNIEnv and JavaVM objects
to your client application, like this:
That’s it for the basic setup. In a theoretical situation where your client
application doesn’t use any Methods or Fields, you’re done here.
Otherwise, read on.
Implementing Methods
Step 1. Create functions
The easiest way to figure out which methods you need to implement is to
run the app as-is and look for FalsoJNI’s errors in logs, particularly with
GetMethodID / GetStaticMethodID functions:
[ERROR][/tmp/soloader/FalsoJNI.c:295][GetMethodID] [JNI] GetMethodID(env, 0x83561570, "SetShiftEnabled", "(Z)V"): not found
[ERROR][/tmp/soloader/FalsoJNI.c:295][GetMethodID] [JNI] GetMethodID(env, 0x83561570, "Shutdown", "()V"): not found
Two important things you get from this log are the method name
("SetShiftEnabled") and the method signature ("(Z)V").
You can learn what each symbol in Java type signature means here.
To cut on the long details, here are a few self-explanatory examples of how
Java method signatures are translated into FalsoJNI-compatible implementations:
// FalsoJNI always passes arguments as a va_list to be able to make single// function implementation no matter how it is called (i.e. CallMethod,// CallMethodV, or CallMethodA ).// "SetShiftEnabled", "(Z)V"voidSetShiftEnabled(jmethodIDid, va_listargs) { // V (ret type) is a voidjbooleanarg=va_arg(args, jboolean); // Z is a boolean// do something
}
// "GetDisplayOrientationLock", "()I"jintGetDisplayOrientationLock(jmethodIDid, va_listargs) { // I (ret type) is an integer// no arguments herereturn0;
}
// "GetUsername", "(Ljava/lang/String;)Ljava/lang/String;"jstringGetUsername(jmethodIDid, va_listargs) { // Ljava/lang/String; (ret type) is a jstringjstring_email=va_arg(args, jstring);
// If you want to work with Java strings, always use respective JNI methods!// They are NOT c-strings.constchar*email=jni->GetStringUTFChars(&jni, _email, NULL);
constchar*username=MyCoolFunctionToLookupUsername(_email);
jni->ReleaseStringUTFChars(&jni, _email, email);
returnjni->NewStringUTF(&jni, username);
}
// "read", "([BII)I"jintInputStream_read(jmethodIDid, va_listargs) { // I (ret type) is an integerjbyteArray_b=va_arg(args, char*); // [B is a byte array.jintoff=va_arg(args, int); // I is an intjintlen=va_arg(args, int); // I is an int// Before accessing/changing the array elements, we have to do the following:JavaDynArray*jda= (JavaDynArray*) _b;
if (!jda) {
log_error("[java.io.InputStream.read()] Provided buffer is not a valid JDA.");
return0;
}
char*b=jda->array; // Now this array we can work with
}
Pay great attention to the last example. Java arrays are notably different
from C arrays by always having the array size information with them, so
FalsoJNI mimics Java arrays behavior with a special struct, JavaDynArray
(or jda in short).
Every time you receive an array of any kind as an argument, you have to get
the “real”, underlying array from it like shown in the example. You can also
use jda_sizeof(JavaDynArr *) function to get the length of the array you
are operating on.
If you need to return an array in Java method implementation, — likewise.
Work with jda->array, return jda.
Also notice the second-to-last example to see how you can work with Java strings.
Step 2. Put them in relevant arrays
Now that you have your implementations in place, the only thing left to do
to allow the client application to use them is to fill in the arrays in the
implementation file you copied from FalsoJNI_ImplSample.h earlier.
You just need to figure out the return types for your methods and come up with
any (unique!) method IDs you like. Example of filling the arrays for methods
from Step 1:
With Fields, it’s basically the same thing. Run your app, look for the errors
in GetFieldID, GetStaticFieldID to figure out the needed Fields names and
signatures (well, just types in this case).
When you know them, fill in the arrays in the same fashion:
Everything else will be taken care of by FalsoJNI.
Tips
There is a very verbose logging in this lib to debug difficult situations.
Either define FALSOJNI_DEBUGLEVEL or edit FalsoJNI.h if you need to change
the verbosity level:
There are things in JNI that can not be implemented without some terrible
overengineering. If you come across one of them, the library will throw
a warning-level log at you.
I tried to keep the code as clean and self-explanatory as possible, but
didn’t have time yet to write a proper documentation. As a direction for
further info, look at FalsoJNI_ImplBridge.h header for common type definitions
and JDA functions.
Keep track of references and destroy objects when there aren’t any left.
Dry Run mode that would record methods/fields definitions to FalsoJNI_Impl.c for you.
Credits
TheFloW and Rinnegatamante for fake JNI interfaces implementations
in gtasa_vita that
served as inspiration and basis for this lib.
License
This software may be modified and distributed under the terms of
the MIT license. See the LICENSE file for details.
Contains parts of Dalvik implementation of JNI interfaces,
copyright (C) 2008 The Android Open Source Project,
licensed under the Apache License, Version 2.0.
Includes converter.c and converter.h,
copyright (C) 2015 Jonathan Bennett jon@autoitscript.com,
licensed under the Apache License, Version 2.0.
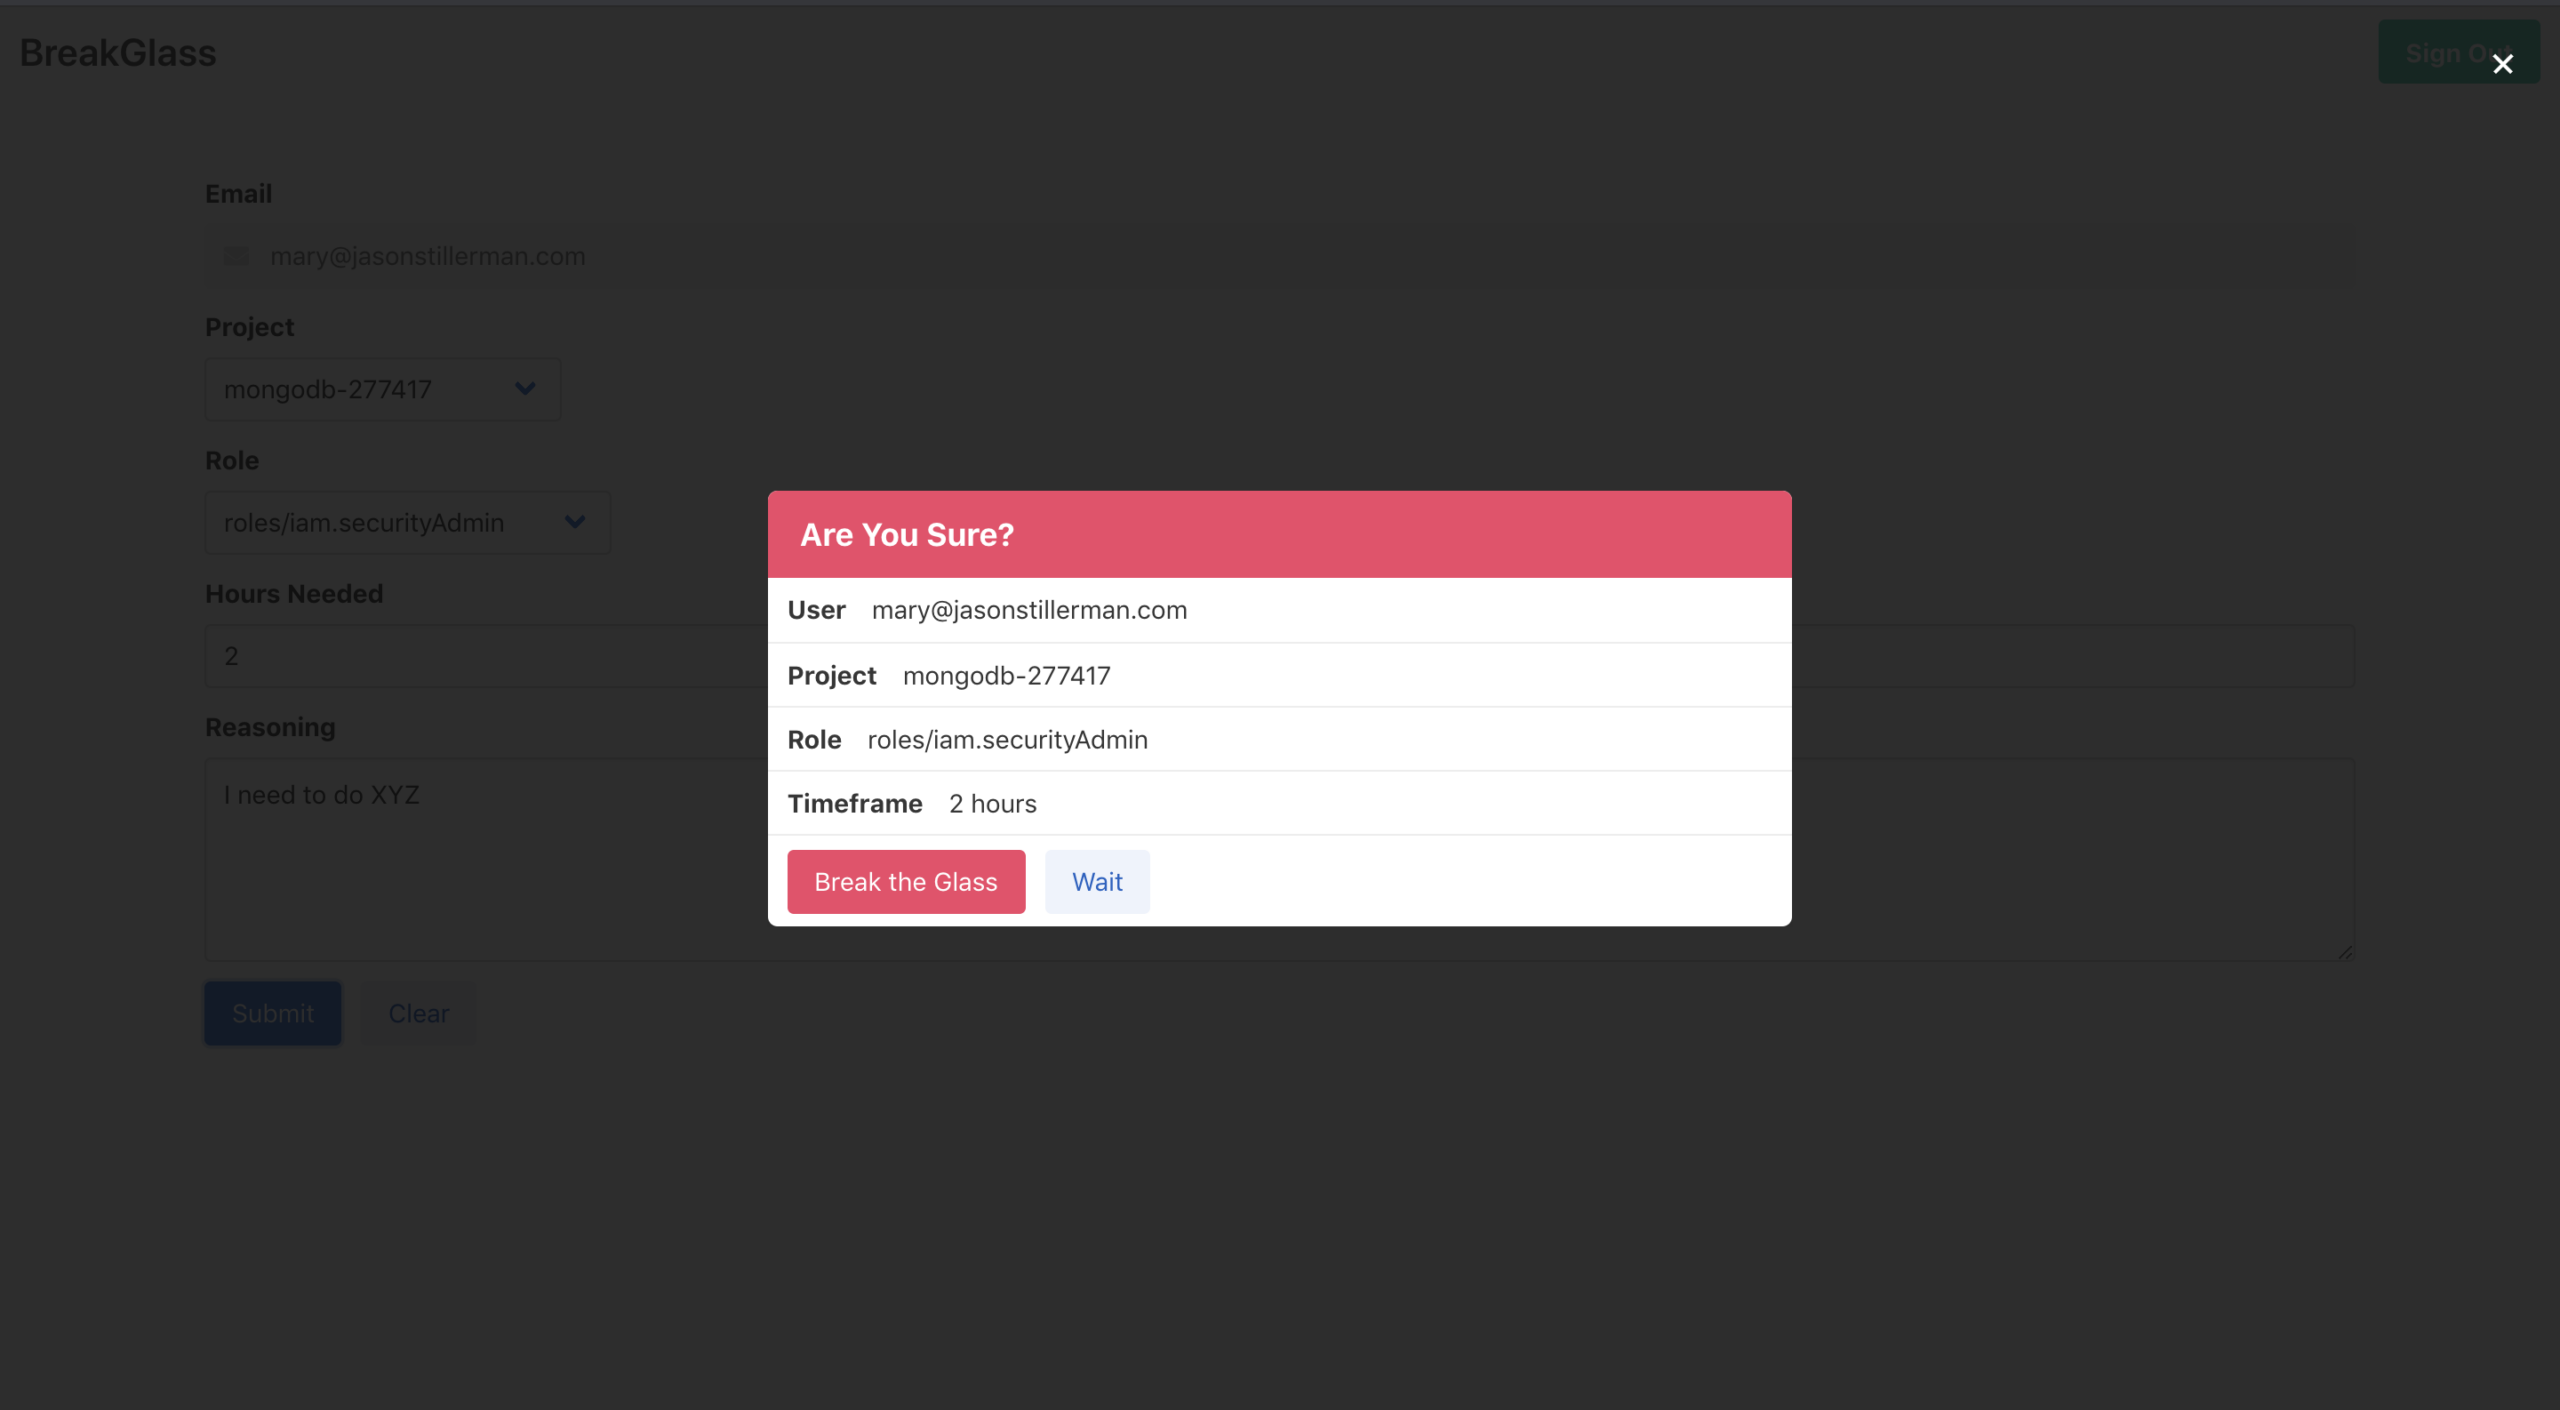
BreakGlass is a tool that allows developers to temporarily escalate their own GCP permissions at any time. This is like the sudo command for GCP permissions. Developers will be able to fix things at 3 AM without waking up the teams RP.
How it works
Sign into the app with your GCP credentials
Select a project
Select the permissions you need
Select a timeframe
Provide your reasoning for breaking the glass
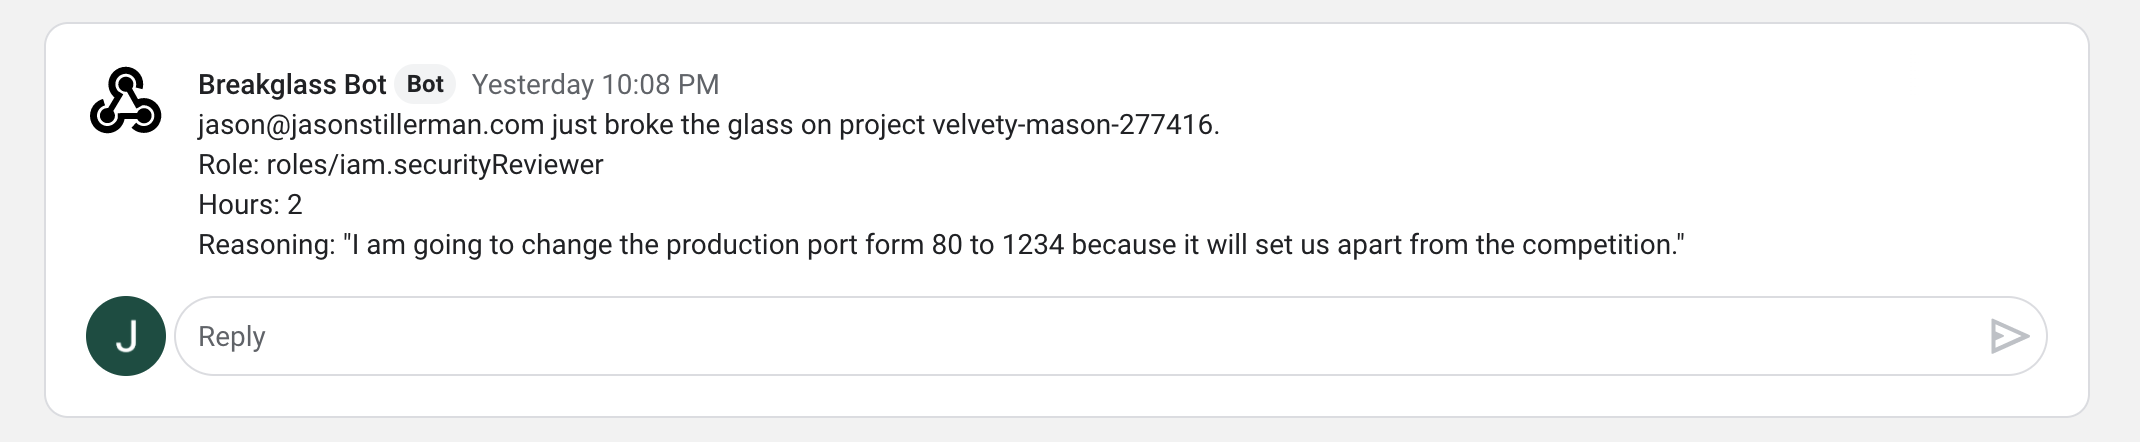
Your permissions will be provided and the event will be logged
Create a new GCP project that will house the BreakGlass server.
gcloud projects create breakglass-{UniqueID} --name="BreakGlass"
Make sure unique ID is a company-specific identifier because the projectID must be unique across all projects on google cloud.
Set that project to default with
gcloud config set project breakglass-{UniqueId}
Create a service account
gcloud iam service-accounts create sa-breakglass \
--description="BreakGlass service account" \
--display-name="sa-breakglass-disp"
--project=breakglass-{UniqueID from above}
You will now be able to see the account with
gcloud iam service-accounts list
It will be something like sa-breakglass@breakglass-{uniqueID}.iam.gserviceaccount.com
Download the key.json file with the following command (be sure you are in the root of the directory you cloned)
gcloud iam service-accounts keys create ./key.json \
    --iam-account {The service account you created above}
Enable the Cloud Resource Manager API HereNote be sure that this is for the project Breakglass!
Next, grant sa-breakglass folder admin in all of the folders that you would like users to have the change to escalate in. Breakglass will only be able to see and update projects where it is the folder admin.
After permissions are configured, run
gcloud projects list
and make sure you can see the projects you want breakglass to have access to. Note It might take 3-5 minutes for the permissions to update and the projects to be visible.
Add OAuth to breakglass project
Go to the cloud console, select the breakglass project and then navigate to APIs & Services -> Credentials. Click “Create Credentials” -> Oauth Client ID -> Configure Consent Screen -> Internal then provide a display name (probably breakglass) -> Save
Now go back to credentials -> Create Credentials -> OAuth Client Id -> Application type: Web Application
Here, you name the key (name doesn’t matter) and you also add “Authorized JavaScript Origins”. Add just “http://localhost:8080” for now, we will come back to this later.
Click create and copy the client ID for later. You won’t be needed the secret.
Configure Breakglass
Copy K8s/breakglass-configmap.yaml.example to K8s/breakglass-configmap.yaml and configure it to your needs. Read about possible configurations here.
Note you will need the OAuth Client Id from the previous step.
Build the project
Build the docker image in the minikube context with
yarn k8s
Configure Kubernetes Project with
minkube start
kubectl apply -f K8s
Now the project will be running, but you have not whitelisted the port on the OAuth, so it will not work as is. Ensure everything is working properly by forwarding the port to the pod
kubectl port-forward {Naem od pod that was created} 8080:8080
aioodbc is a Python 3.7+ module that makes it possible to access ODBC databases
with asyncio. It relies on the awesome pyodbc library and preserves the same look and
feel. Internally aioodbc employs threads to avoid blocking the event loop,
threads are not that as bad as you think!. Other drivers like motor use the
same approach.
aioodbc is fully compatible and tested with uvloop. Take a look at the test
suite, all tests are executed with both the default event loop and uvloop.
Basic Example
aioodbc is based on pyodbc and provides the same api, you just need
to use yield from conn.f() or await conn.f() instead of conn.f()
Properties are unchanged, so conn.prop is correct as well as
conn.prop = val.
FB-BEV and FB-OCC are a family of vision-centric 3D object detection and occupancy prediction methods based on forward-backward view transformation.
News
[2023/8/01] FB-BEV was accepted to ICCV 2023.
🏆 [2023/6/16] FB-OCC wins both Outstanding Champion and Innovation Award in Autonomous Driving Challenge in conjunction with CVPR 2023 End-to-End Autonomous Driving Workshop and Vision-Centric Autonomous Driving Workshop.
This work is made available under the Nvidia Source Code License-NC. Click here to view a copy of this license.
The pre-trained models are shared under CC-BY-NC-SA-4.0. If you remix, transform, or build upon the material, you must distribute your contributions under the same license as the original.
If this work is helpful for your research, please consider citing:
@inproceedings{li2023fbbev,
  title={{FB-BEV}: {BEV} Representation from Forward-Backward View Transformations},
  author={Li, Zhiqi and Yu, Zhiding and Wang, Wenhai and Anandkumar, Anima and Lu, Tong and Alvarez, Jose M},
  booktitle={IEEE/CVF International Conference on Computer Vision (ICCV)},
  year={2023}
}
@article{li2023fbocc,
  title={{FB-OCC}: {3D} Occupancy Prediction based on Forward-Backward View Transformation},
  author={Li, Zhiqi and Yu, Zhiding and Austin, David and Fang, Mingsheng and Lan, Shiyi and Kautz, Jan and Alvarez, Jose M},
  journal={arXiv:2307.01492},
  year={2023}
}
Acknowledgement
Many thanks to these excellent open source projects: